
The ice is melting everywhere, including Antarctica. So we’re science-ing the hell out of Antarctica, measuring the ice, the land, the air, everything. And nothing is as important to grok what is happening to the icecap as the ocean.
In the case of Antarctica, it’s surrounded by the Southern Ocean, which features storms and currents which move warm water south towards the ice and north into the tropics. These flows have a lot to do with how the ice behaves at the shores of Antarctica, as well as how the atmosphere behaves over the continent.
This ocean is huge, dangerous, and far away from were people live. So we have relatively little detailed information about it, which limits the accuracy of climate models for the area. We can’t predict the weather, ice, or anything very well without good data about the ocean.
One of the missing pieces has been a map of the ocean floor. We know that sea ice and glaciers stick to the bottom if it is shallow enough, so the depth of water right off shore is a big influence on where the ice flows fast or slow into the sea.
Undersea mountains and trenches have significant effects on currents at various depths. These currents carry fresh water from precipitation and melting ice to mix into the saltier sea water, and also carry heat from warm water to cool water, and vice versa. Exactly where these currents flow makes a huge difference to how fast the ice melts in a particular place.
In short, we want a good map of the ocean bottom.
This summer, version 2 of the International Bathymetric Chart of the Southern Ocean (IBCSO) has been released [2]. This dataset collects the best possible measurements of the sea bottom, and extends previous coverage from 60 degrees to 50 degrees south. This is a very important increment, because the new coverage includes the Drake passage and critical regions of the Antarctic Circumpolar Current.
The dataset is aggregated from measurements by surface ships, aircraft, and satellites. Surface ships yield the most accurate and hi res data, but have limited coverage. Lower quality air and space measurements are used to fill in as much of the area as possible.
Overall, on a grid of 500m squares, 23% of the cells have at least one depth measurement. This is sparse, but it’s a lot better than version 1, which had only 17% coverage, all south of 60 degrees. So, this is more area, and more data everywhere.
In addition to navigation and modelling, this undersea terrain records past behavior of the ice [1]. Studying these records will give us a better idea of where the ice was in past ages, which will improve models of how the climate has evolved over long periods.
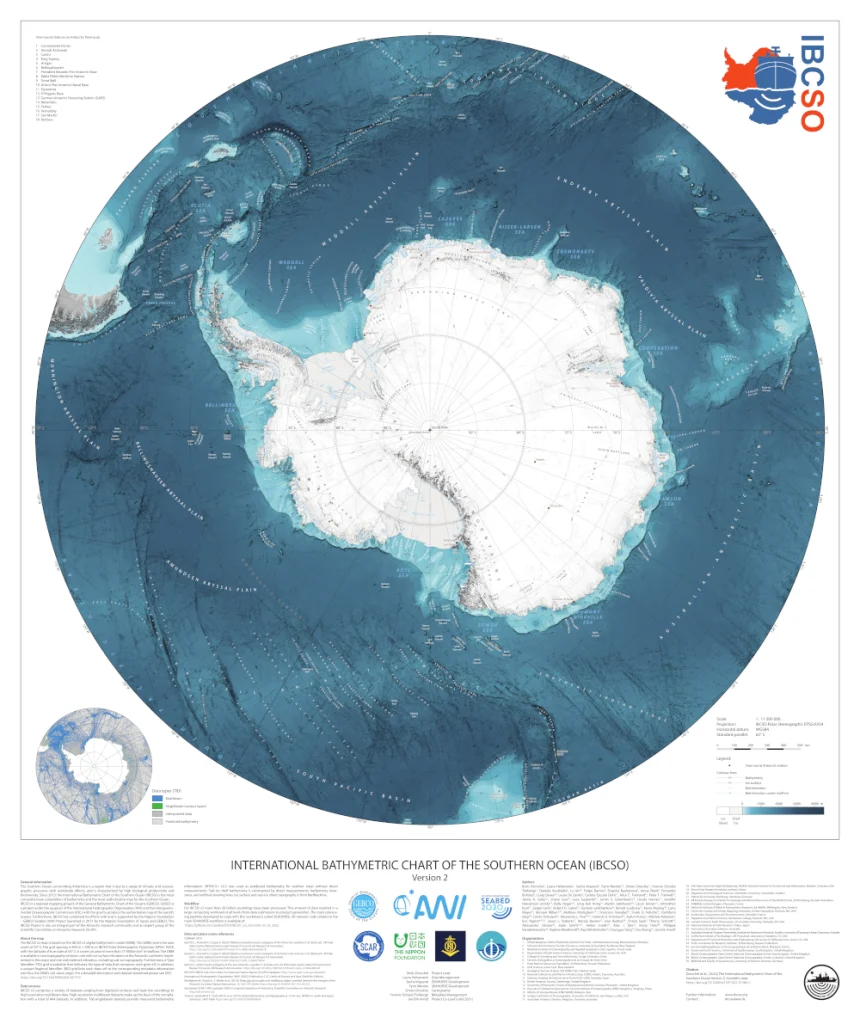
(Glancing at the map with a naked eye, I’m intrigued by the swirling pattern discernable in the sea bottom. It looks like the elevation features reflect the continent rotating clockwise relative to the globe, or other processes pushing the seabed counter clockwise. Maybe it’s my imagination, but it’s interesting.)
- Jonathan Amos, Antarctica: Southern Ocean floor mapped in greatest ever detail, in BBC News – Science & Environment, June 8, 2022. https://www.bbc.com/news/science-environment-61723806
- Boris Dorschel, Laura Hehemann, Sacha Viquerat, Fynn Warnke, Simon Dreutter, Yvonne Schulze Tenberge, Daniela Accettella, Lu An, Felipe Barrios, Evgenia Bazhenova, Jenny Black, Fernando Bohoyo, Craig Davey, Laura De Santis, Carlota Escutia Dotti, Alice C. Fremand, Peter T. Fretwell, Jenny A. Gales, Jinyao Gao, Luca Gasperini, Jamin S. Greenbaum, Jennifer Henderson Jencks, Kelly Hogan, Jong Kuk Hong, Martin Jakobsson, Laura Jensen, Johnathan Kool, Sergei Larin, Robert D. Larter, German Leitchenkov, Benoît Loubrieu, Kevin Mackay, Larry Mayer, Romain Millan, Mathieu Morlighem, Francisco Navidad, Frank O. Nitsche, Yoshifumi Nogi, Cécile Pertuisot, Alexandra L. Post, Hamish D. Pritchard, Autun Purser, Michele Rebesco, Eric Rignot, Jason L. Roberts, Marzia Rovere, Ivan Ryzhov, Chiara Sauli, Thierry Schmitt, Alessandro Silvano, Jodie Smith, Helen Snaith, Alex J. Tate, Kirsty Tinto, Philippe Vandenbossche, Pauline Weatherall, Paul Wintersteller, Chunguo Yang, Tao Zhang, and Jan Erik Arndt, The International Bathymetric Chart of the Southern Ocean Version 2. Scientific Data, 9 (1):275, 2022/06/07 2022. https://doi.org/10.1038/s41597-022-01366-7
