Tag Archives: Jonathan Amos

Halley Station On Shifting Ice

The British Antarctic Survey has been on the Brunt Ice Shelf in East Antarctica for sixty some years.  The Halley Research Station (Once known as Station Z!) has been rebuilt and relocated over the years. The current incarnation is Halley VI, and it is a pretty cool modular and movable habitat.  (There are lots of cool info and vids at their web site.)

Lots of science is goin’ on, down Halley way.  But one particular target is continuous measurements and observations of the Brunt Ice Sheet itself.  Brunt is a sheet of ice floating on the ocean, which has been fairly stable over the time that Halley station has been there.  The ice sheet has slowly move out to sea, in fits and starts.  Researchers have observed that the ice was slowed or halted when the underside hit bottom, grounded, at a shallow spot, called the McDonald Ice Rumples.  (Above the grounding point, the ice is pushed up and rumpled.)

In recent years, Brunt has rapidly shed two huge ice bergs (A74 and A81).  It isn’t clear what caused these chunks to break off.  There doesn’t seem to be any short term stimulus, and researchers emphasize that the behavior of the ice is not linked to climate change. 

Ice is as ice does, or something like that.

After the separation of these two massive amounts of ice (A81 calved in January 2023), the reduced ice shelf has begun to move out to sea much more rapidly [1]. 

Data from GPS and satellite images shows that Halley accelerated from 900m / year at the beginning of 2023, to 1500 m / year in August.   This is a pretty good clip for a chunk of ice the size of a county!

Since Halley is sitting on the ice, researchers there have a front row seat and are providing measurements as it is happening [2].   They observe that the ice has un-grounded and floated free.  Presumably, the calving reduced the weight of the ice sheet, causing it to bob up and come free.

“[T]he observations presented show that large calving events which disrupt buttressing at key pinning points can substantially and immediately impact ice flow

([2], p. 4)

It is important to note that the Halley Ice Sheet is not similar to many parts of Antarctica and elsewhere, where fast descending glaciers push out over and into the water.  Halley is fed only by slow moving ice fields, accumulating over years.  This means that this ice sheet is not quickly replenished if it moves, so this sudden shift is thinning the ice.

A second point to note is that this, and most ice sheets, move in fits and starts.  Over the years of observations, and from geological evidence, we know that Halley has moved in the past and then “settled down” for long periods.  So it is very possible that, after this calving event, the ice will bob up and then settle down.

Anyway, should it be necessary, the current Halley VI can be moved to a safe location on the ice.


  1. Jonathan Amos, Halley station: Rapid ice movement monitored under UK polar base, in BBC News – Science & Environment, eptember 13, 2023. https://www.bbc.com/news/science-environment-66685821
  2. O. J. Marsh, A. J. Luckman, and D. A. Hodgson, Brief Communication: Rapid acceleration of the Brunt Ice Shelf after calving of iceberg A-81. EGUsphere, 2023:1-9,  2023. https://egusphere.copernicus.org/preprints/2023/egusphere-2023-1949/

PS. Some great names for a ban:


McDonald Ice Rumples (or just Ice Rumples)
Reduction of Buttressing
Grounding Line

Proposing A Marker for the Anthropocene Epoch

Our planet is obviously in a period where the big news, the only news, is the impact of us, billions of swarming primates, monkeying with everything.  And there is little question that many of the changes we have wrought will be visible for centuries.  We are leaving a geological trace.

For those who are into these things, these changes rate a name, a new geological epoch, tagged the Anthropocene.  This formal title requires a formal definition of when it started and how it is identified in geological records. 

Let the arguments begin! 

This summer, researchers are discussing a proposed geological benchmark, remarkable mud from Crawford Lake in Ontario [1]. This deposit has fine grained annual layers which contain important markers of the Earth’s atmosphere and climate each year.  These layers record, year by year, deposits of Carbon (from burning fossil fuels) and, starting in 1945, radioactive fallout.  These two chemical signatures will be visible in the geologic record for a long time, so they are key markers of the new Anthropocene Epoch.

If this site comes into common use as a reference, our current time will be termed the “Crawfordian age”.  (There are other candidate sites, and no small amount of international scientific politics on this topic, so this may not be a done deal.)


This is a very unusual bit of geological terminology, because these “objective” measures are being retrofitted onto a human history that we have plenty of information about.  I mean, the Crawford sequences did not “reveal” a spike in Plutonium in the atmosphere.  We knew about that.  It is just a clear demonstration that those events have left a geological record.

This is also a pretty arbitrary choice for a boundary.  Sure, 1950 is a nice round date, and nuclear explosions are a notable technical milestone.  But the Carbon emissions started rising in the 1800s, and humans have been modifying ecologies for millennia.  So, 1950 is kind of a random point in a rising tide.

Circa 1950 does have one really big argument in its favor.  The Anthropocene is the first geologic Epoch that is an interplanetary period.  In the last 70 years, humans have left traces in nearby space and nearby bodies, including the moon, Mars, and Venus.  All the junk in orbit will fall to Earth leaving traces, and a lot of the stuff we are leaving on the moon and other places will persist for a long, long time. 

On the other hand, sea level has begun rising only recently, corresponding to the retreat of ice everywhere.  And my own favored marker for the start of the Anthropocene will be a big, sudden rise in sea level triggered by the melting of Antarctica and likely accompanied by massive shifts in ocean currents.  Now that will leave geological traces.  Not that there will be very many puny primates around to record it! : – (

So, from this perspective, we are still in the tail of the Holocene—everything is still recognizable, and mostly intact.  But the next century could well see a really big planet-wide transition.  That is what I would define as the beginning of the new Epoch, and it hasn’t quite happened yet.

Of course, the specifics of geological nomenclature are, as always, purely academic.  However it is formally defined, the idea of the Anthropocene is the important thing.  Humans have modified the planet, and indeed, the solar system.  Whatever happens, these changes will be evident for a long, long time, even in the geological history of our solar system.

And they say my generation hasn’t accomplished anything!


  1. Jonathan Amos, The Anthropocene: Canadian lake mud ‘symbolic of human changes to Earth’, in BBC News – Science & Environment, July 12, 2023. https://www.bbc.com/news/science-environment-66132769
  2. The Associated Press, Scientists say new epoch marked by human impact — the Anthropocene — began in 1950s, in NPR News, July 11, 2023. https://www.npr.org/2023/07/11/1187125012/anthropocene-crawford-lake-canada-beginning

Large Water Plume Out of Enceladus

We have to go to Enceladus!  (Eventually.)

The Cassini mission (2004-2017) swooped near, imaging and even sampling the cryovolcanic plumes of water and ice gushing out from the geysers.  Where there is liquid water, there is complicated chemistry, and possibly life like on Earth [1].

This summer a team of researchers used the James Webb Space Telescope to look carefully at Enceladus [2].  They were look for signatures of organic molecules as well as water.

As with the Hubble ST, the James Webb ST is not just for looking far away.  It can be used to image relatively close up, such as moons of Saturn. 

The images are pretty amazing, considering that Enceladus is about 500km in diameter, and it’s more than a billion km away.  It’s not how well the telescope works, it’s that it works at all!

The observations didn’t find organic molecules, but it did spot a plume of water and ice.  A big plume, like 40 times the diameter of Enceladus.  This is a really big eruption!

No missions are approved to visit Enceladus at this time. Two missions are heading out to study the icy moons of Jupiter, which seem to have liquid water and complex chemistry. 

I can see the point.  If you can only visit one of the two planets, the moons of Jupiter are probably a lot more interesting.  Enceladus is neat, but so far it is looking like it is a water world with no organic chemistry.  It is very small, and may well have been completely frozen most of it’s lifetime.  In comparison, the larger moons of Jupiter probably have had liquid water for a substantial period.


  1. Jonathan Amos, James Webb telescope: Icy moon Enceladus spews massive water plume, in BBC News – Science & Environment, May 31, 2023. https://www.bbc.com/news/science-environment-65765203
  2. G. L. Villanueva, H. B. Hammel, S. N. Milam, V. Kofman, S. Faggin, C. R. Glein, R. Cartwright, L. Roth, K. P. Hand, L. Paganini, J. Spencer, J. Stansberry, B. Holler, N. Rowe-Gurney, S. Protopapa, G. Strazzulla, G. Liuzzi, G. Cruz-Mermy, M. El Moutamid, M. Hedman, and K. Denny, JWST molecular mapping and characterization of Enceladus’ water plume feeding its torus (accepted). Nature Astronomy,   May 17 2023. https://psg.gsfc.nasa.gov/apps/Enceladus_JWST.pdf

Heat Shield Idea from Wales

Britain seems to be pushing to become a (minor) space power.  I have my doubts.  A space program is a huge money sink, highly risky, and the business model is a big question mark.  As I used to tell sponsors of software projects, “We can get rid of as much money as you want to.”

But I don’t doubt the technical potential of the clever elves who inhabit the British isles.  The folks who brought us radar and computers can do neat stuff in space.  (Such as Mithril-like radar dishes.)

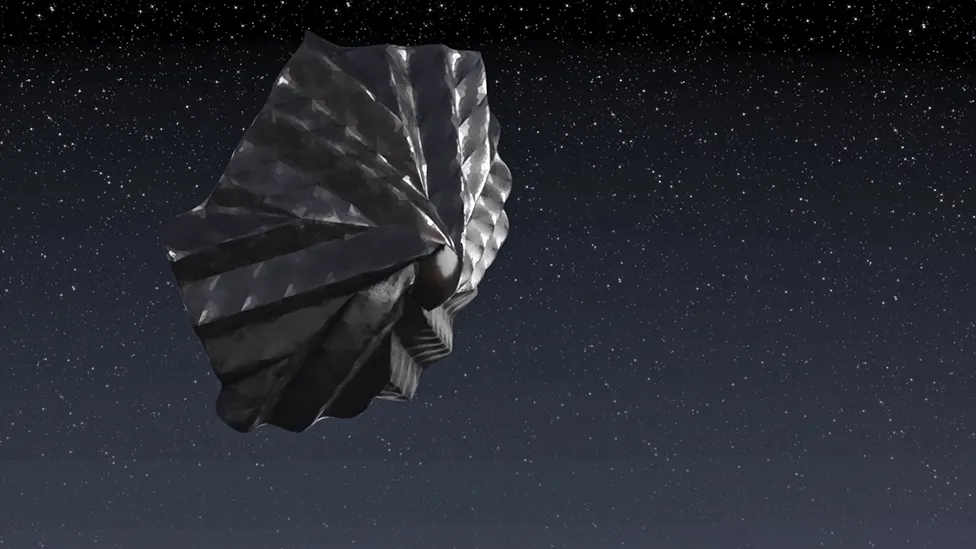
This spring, a company in Wales describes their concept for a reusable heat shield for atmospheric entry [1].   The concept looks a lot like, and works like, a shuttlecock.  Basically, a big, thin umbrella-like cone folds tight for launch, and unfurls for reentry.  The capsule is designed to be netted in the air, which is always cool, if risky.

Artwork: Packed away tightly for launch, the heatshield would spring out for re-entry Image Credit: Space Forge (From [1])

I gather that the heat shield doesn’t ablate.  It works because it is very large with a lot of surface area to radiate away the heat.

If I understand correctly, the idea is to launch small factories into low orbit, to do high value zero gravity manufacturing, and then return the whole thing to Earth.  And repeat.  The economics depend on reusing the satellite as much as possible, hence the reusable heat shield.

I can’t speak to the business model.

I have to think that there are a lot of ifs in this design.  I mean, unpowered reentry is a tricky business in all cases, and this design is going to be unstable—like a shuttlecock.  Catching a weaving, bouncing shuttlecock falling from orbit is going to be a heck of a circus act!  And you can’t afford to miss, not even once.

I gather that the first space test is in the works for later this year.  We’ll see how well they can make it work!


PS.  They call this Pridwen, the Welsh name of Arthur’s shield.  That’s cute, and patriotic, and so on.  Very Welsh.  But it’s a terrible moniker, IMO.  Noone outside Wales can say it, and it offers no immediate associations for most of the world.  If you want people to know what it its, call it “Arthur’s Shield” if you must, or something intelligible.


  1. Jonathan Amos, Welsh space firm devises ‘shuttlecock’ heatshield, in BBC News – Science, May15, 2023. https://www.bbc.com/news/science-environment-65592872

Interesting Satellite Design

It’s not origami—it’s knitting!

One of the perpetual challenges for spacecraft is the need to have large antennas, launched in small, compact rockets.  Spacecraft have to unpack and deploy complex arrays without human assistance, and with no hope of on the spot help if something goes wrong.  The whole mission will be lost if that umbrella doesn’t open like it is supposed to!.

In recent years, engineers have looked at many interesting techniques for unfoldable shapes, including inspirations from biology and origami. 

This spring, Oxford Space showed off a new springy radar antenna that is an umbrella like dish, made of a flexible titanium fabric [1].  The fabric is knitted.  Not by hand, but with an industrial knitting machine, which are pretty cool in and of themselves.

The input to the knitting matchine is very fine gold-plated titanium wire, which produces a beautiful, light, strong fabric.  OK, this cloth is probably a bit pricey for everyday use!  But it’s got to stand up to outer space, and there is no chance to fix a rip or scuff.

The overall mechanism is simple. The ribs snap into form when released, pulling the fabric tight.  No motors, cables, hinges, etc. to go wrong.

“The gold-plated tungsten mesh is attached to series of carbon-composite rods which can be wound radially against a central hub.”

(from [1])

The resulting dish is part of a 3- or 5-meter radar dish.  From orbit, this should have resolution less than a meter. 

Pretty neat.


  1. Jonathan Amos, UK ‘knitted satellite’ will see Earth day or night, in BBC News – Science & Environment, May 5, 2023. https://www.bbc.com/news/science-environment-65483204

Global Assessment of Glaciers

One of the most visible changes on this planet has been the retreat of the glaciers.  This has been noticeable, indeed, obvious in many locations.  And a lot of us suspect that glaciers are retreating rapidly everywhere.

But there are a lot of glaciers, and it’s not that simple to measure them.

This is a job for satellites!  And, indeed, ESA is planning a new satellite, tagged Cristal, that will measure glaciers.  Meanwhile, we have ESA’s old-lady, Cryosat, still working significantly past her design lifetime.  

This spring, (bourgeois?) researchers at Edinburgh and Strasbourg report an analysis of radar altimetry data collected by Cryosat from 2010 to 2020 to estimate the mass changes in glaciers for the whole planet [2].  There’s life in the old girl, yet!

If I understand correctly, the basis of the study is a refined technique to infer the “mass discharge”, i.e., how much ice is being moved down the glacier.  Other measures give estimates of changes in ice from thinning, but for glaciers (as compared to, say, ice caps) the contribution of “discharge” varies, but is significant.

I gather that this dynamic loss is difficult to measure from older satellite data.  It obviously requires the right temporal coverage, i.e., repeated measures of the relevant areas.  The technique described here infers the change in ice mass from thinning and discharge (but not from retreating frontage).

Over the ten years covered, they estimate that altogether the Earth’s glaciers lost 2% of their mass.  Most of that loss (89%) was from thinning, but in some areas, such as Russian Arctic islands and South America, accelerating discharge was a large contribution to the losses. 

Glacier mass changes between August 2010 and August 2020. The regions displayed are Alaska (ALA), Arctic Canada North (ACN), Arctic Canada South (ACS), Greenland Periphery (GRL), Iceland (IC), Svalbard (SV), Franz-Josef-Land (FJL), Novaya Zemlya (NZ), Severnaya Zemlya (SZ), High Mountain Asia (HMA), Southern Andes (SAN) and Antarctic Periphery (ANT). The size of the circles is proportional to the mass loss, with the thickness of the line representing the uncertainty (1-sigma). The inner circle slice (purple shading) displays the proportion of mass loss due to discharge anomaly (Da). The numbers display mass change in Gigatonnes per year [Gt yr−1]. Glacier location based on the Randolph Glacier Inventory 6.0 masks are indicated in red. Graph (a) displays total cumulative monthly mass changes in Gigatonnes [Gt] (gray line and shading, left y-axis), annual mass change [Gt] (red bars and error bars, right y-axis) and 3-year averages of annual mass changes (red dotted line, right y-axis). Graph (b) displays various published global estimates of global mass change and their respective time spans with 1-sigma uncertainties. Our estimates for Greenland and Antarctic peripheral glaciers are added to Ciracì et al. (2020) and Wouters et al. (2019), which both do not distinguish between peripheral glaciers and ice sheet mass change. (From [2])

“We estimate a global mean mass loss of 272 ± 11 Gt yr −1 (1-sigma uncertainties) between 2010 and 2020, which corresponds to a loss of 2% of global glacier ice volume.”

([2], p. 4)

These findings suggest that the bulk of the loss of ice is due to warming atmosphere, though the areas with high discharge losses are affected by sea temperatures [1].

The new Cristal satellite will be able to measure these changes in the ice on into the future.  Ideally, Cryosat will hang on until Cristal comes on line after 2028, so we can get an overlapping dataset. 

Anyway, it’s always good to see new results squeezed out of old satellite data!


  1. Jonathan Amos, Climate change: Satellite maps warming impact on global glaciers, in BBC News – Science & Environment, April 28, 2023. https://www.bbc.com/news/science-environment-65399580
  2. Livia Jakob and Noel Gourmelen, Glacier Mass Loss Between 2010 and 2020 Dominated by Atmospheric Forcing. Geophysical Research Letters, 50 (8):e2023GL102954, 2023/04/28 2023. https://doi.org/10.1029/2023GL102954

Bouncing Glaciers

Many glaciers terminate in the ocean, pushing along the bottom until they are fully floating.  When a glacier retreats (i.e., melts), it gets thinner, too, and can float free of the bottom at high tide, to drop back to the bottom at low tide. 

In times when a glacier is melting rapidly, it may “hop”, leaving a record of parallel ridges recording its daily movements. These formations directly indicate the behavior of the glacier, including the speed that it changed in past episodes of melting.  These formations are rare and hard to access, but this information may tell us just how fast glaciers changed in the past and may change today and in the near future.

Earlier studies have found that some Antarctic may be retreating 250 m per year (almost a meter per day overall), which is not a bad clip for a zillion-ton chunk of ice.

This spring researchers in the UK and Norway report a study of an area of the North Sea which has parallel ridges likely made by retreating glaciers 15,000 years ago (i.e., the last major melt off) [2].  The spacing of the ridges suggests that the glacier retreated between 55m and 610m per day.  Wow!

This is 2-20 times faster than has been measured on current glaciers.

To be sure, this particular area is very flat, which means that relatively small changes in buoyancy would have enabled large lateral movements.  I.e., this area is a place where the glacier could slide easily. Other terrain would not see as much change for the same ice and ocean.

Also, this behavior is only one aspect of glacier retreat, and is highly local.   It reflects one part of one glacier, and it may or may not indicate the rapid pace of melting overall.

Still, this does show that there can be sudden “pulses” of change as glaciers retreat.  The researchers will incorporate these processes into computer models of Antarctica, to try to understand and predict how the ice is changing today [1].


  1. Jonathan Amos, Climate change: Norwegian seafloor holds clue to Antarctic melting, in BBC News – Science & Environment, April 6, 2023. https://www.bbc.com/news/science-environment-65192825
  2. Christine L. Batchelor, Frazer D. W. Christie, Dag Ottesen, Aleksandr Montelli, Jeffrey Evans, Evelyn K. Dowdeswell, Lilja R. Bjarnadóttir, and Julian A. Dowdeswell, Rapid, buoyancy-driven ice-sheet retreat of hundreds of metres per day. Nature,   2023/04/05 2023. https://doi.org/10.1038/s41586-023-05876-1

Antarctic Sea Ice Extent 2022

The US National Snow and Ice Data Center (NSIDC) is a key locus for current studies of the Earth’s cryposphere (AKA, “science-in’ the hell out of the melting ice”).   Their web site has tons of information and pointers to lots more.   Among other things, there is a “Greenland and Antarctic Ice Sheet Today”, (“Follow the melt year-round with daily images & scientific analysis”)

The NSIDC also issues reports on trends and predictions.

This month the Arctic Sea Ice News and Analysis blog reported that observations indicate that “Antarctic sea ice extent sets a new record low” in 2022 [2].  In fact, it has tracked well below any measured year.  (The data only extends back to 1975.)  (The BBC reports that cruise ships confirm that most of the area is ice free [1].)

The sea ice is the floating ice that builds up in the southern winter and melts off in the summer.  The minimum occurs at the end of the summer, i.e., about mid to late February. 

However, sea ice is definitely influenced by warm water and air conditions, and also by strong winds and storms.  A low extent suggests that many parts of the Antarctic coast are warmer than usual.  Probably. 

Sea ice does not influence mean sea level much because it is floating on the water.  But it is an important driver of ocean currents.  The floating ice is frozen from the surface of the sea, which leaves behind the salt in the water under the ice.  This saltier water is denser and sinks, driving ocean currents. This moves heat and nutrients through the ocean. 

It is important to note that the overall story is that the sea ice extent, and by implication, sea and air conditions, have been variable in the last decade.  While 2021 and 2022 were record low sea ice extents, other recent years were as high as any recorded years.  The overall trend line has a slope about zero.

Since we only have good data for 40 some years, we really don’t know if this variability is common or not, or what longer term trends might show.  The older data we do have suggests long fluctuations occured.  They also suggest that the southern ice hasn’t followed the same trends as the Arctic and Greenland.  So there is a lot of uncertainty.

All the more reason to keep “following the melt”, to see if this sudden dip persists, and if so, what caused it.


  1. Jonathan Amos and Erwan Rivault, Antarctica sea-ice hits new record low, in BBC News – Science February 16, 2023. https://www.bbc.com/news/science-environment-64649596
  2. National Snow and Ice Data Center (NSIDC), Antarctic sea ice extent sets a new record low, in Arctic Sea Ice News and Analysis, February 14, 2023. https://nsidc.org/arcticseaicenews/2023/02/antarctic-sea-ice-extent-sets-a-new-record-low/

Meanwhile, Under Thwaites

The ice is melting everywhere.  That much is clear.  Glub!

But there is a lot of ice and the process is complicated, so there’s a lot we don’t understand and can’t predict.

One place that the ice is changing fast is West Antarctica, hundreds of kilometers west of the calving Brunt ice sheet.

The Thwaites glacier has been retreating rapidly for decades, dumping huge amounts of fresh water into the ocean.  Like, enough water to increase sea level by a millimeter over the past 20 years.  The pace of retreat as been increasing, and if the who ice sheet were to suddenly melt, it would raise sea level by half a meter—knee deep.

We really need to know what’s going on down Thwaites way.

So, as I have commented before, we are sciencin’ the hell out of it.

The International Thwaites Glacier Collaboration has worked for many years to send an expedition to look under the ice.  This winter we are seeing some results [1].

One study drilled a borehole through the ice to lower instruments to measure properties of the water under the ice [2].  The hole was “drilled” by pouring hot water on the ice to punch down through 500 meters (!) of ice near the current grounding line.

A second study deployed a robot submarine, called Icefin, through the borehole, which returned real time imagery as well as measurements of water conditions at the grounding line [4]. 

The data from this campaign will contribute to a more detailed understanding of what’s going on in this very interesting part of the world.

This expedition visited the area where the ice meets the ocean.  The front of the glacier slides along the bottom and melts away as the relatively warm melts the ice from below.  The retreat of Thwaites has been speeding up because rivers of warmer water have pushed closer to the coast, digging out the ice from below. (The BBC has some nice illustrations of this process [1].)

The new measurements explored in detail one place where the warm water is melting the ice.  The submarine went right up to the grounding line, measuring what’s going on at this critical point.

So what does this mean?

The data gives a detailed (if localized) view of the water and bottom of the ice.  The picture is complicated, as you’d expect.  The bottom of the ice isn’t a smooth like a skating rink.  It’s complex, eroded terrain, with ridges and upward reaching cracks.  This means that melting could be a lot faster than would be true of a smooth surface, because warm water can penetrate and contact a large surface area.

However, measurements of the water indicate that it is stagnant, i.e., there is not much movement or turbulence.  It is layered, which do not rapidly transfer the heat from relatively warm layers to the ice.  In particular, there is a layer of fresh water just under the ice that insulates the bottom of the ice from the warmer ocean water below.  This means that the ice is not going to melt as fast as the average temperature of the water would suggest.

So, while Twaites has been melting as fast as pretty much anywhere in Antarctica, it’s probably not melting as fast as the change in water temperature could cause.  That’s both good and bad.  The warm water doesn’t cause as much loss as it could.  But Thwaites has been melting fast and faster anyway, which means that even this much warming is having a major effect.

Overall, this means that the worst-case scenario is “a little less worse” than feared (Researcher Ted Scambos quoted in [3].)

This could be a mantra for the early twenty first century.  We are happy to say that ‘the worst-case scenario is a little less worse that we feared’.

Sigh.


  1. Jonathan Amos, Thwaites Antarctica glacier at mercy of sea warmth increase, in BBC News – Science, February 15, 2023. https://www.bbc.com/news/science-environment-64640796
  2. Peter E. D. Davis, Keith W. Nicholls, David M. Holland, Britney E. Schmidt, Peter Washam, Kiya L. Riverman, Robert J. Arthern, Irena Vaňková, Clare Eayrs, James A. Smith, Paul G. D. Anker, Andrew D. Mullen, Daniel Dichek, Justin D. Lawrence, Matthew M. Meister, Elisabeth Clyne, Aurora Basinski-Ferris, Eric Rignot, Bastien Y. Queste, Lars Boehme, Karen J. Heywood, Sridhar Anandakrishnan, and Keith Makinson, Suppressed basal melting in the eastern Thwaites Glacier grounding zone. Nature, 614 (7948):479-485, 2023/02/01 2023. https://doi.org/10.1038/s41586-022-05586-0
  3. Henry Fountain, Scientists Get a Close-Up Look Beneath a Troubling Ice Shelf in Antarctica, in New York Times. 2023: New York. https://www.nytimes.com/2023/02/15/climate/thwaites-antarctica-melting-robot.html
  4. B. E. Schmidt, P. Washam, P. E. D. Davis, K. W. Nicholls, D. M. Holland, J. D. Lawrence, K. L. Riverman, J. A. Smith, A. Spears, D. J. G. Dichek, A. D. Mullen, E. Clyne, B. Yeager, P. Anker, M. R. Meister, B. C. Hurwitz, E. S. Quartini, F. E. Bryson, A. Basinski-Ferris, C. Thomas, J. Wake, D. G. Vaughan, S. Anandakrishnan, E. Rignot, J. Paden, and K. Makinson, Heterogeneous melting near the Thwaites Glacier grounding line. Nature, 614 (7948):471-478, 2023/02/01 2023. https://doi.org/10.1038/s41586-022-05691-0

Europa, Ho!

Europa, Ho!

It’s been clear for quite a while that we must explore the ice worlds of our solar system.   This has not been lost on space agencies, and the time is now—on both sides of the Atlantic (ESA, and NASA).

It’s really happening, at last!

ESA’s Jupiter Icy Moons Explorer (JUICE)  spacecraft has passed the final review, and is now ready to dispatch to the launch site for an April blastoff.  After an 8 year cruise, JUICE will visit Callisto, Ganymede and Europa circa 2031-2035, ending in orbit around Ganymede [1].

JUICE carries a pretty comprehensive suite of instruments for imaging in many wavelengths, a laser altimeter and a radar sounder, and other instruments.  A series of flybys will gather a wealth of data, and should tell us a lot about what is under the ice.  JUICE is not looking for biomarkers, per se, but will examine the general conditions relevant to life as we know it.

But wait! 

NASA is also preparing to launch The Europa Clipper, which will explore Europa in the same time period.  The spacecraft is under construction, in preparation for a 2024 launch date [2].  It will actually arrive at Europa slightly before JUICE, where it will do multiple flybys for several years starting in 2030.

The Europa Clipper has a similar suite of instruments for imaging and looking through the ice.  And, like JUICE, the Clipper will sample space as it flies by, which may detect organic molecules.  The main target of the Clipper is analysis of the interior ocean, seeking to detect evidence for life, i.e., heat and chemicals. 

Both of these spacecraft have to be heavily shielded because Jupiter’s neighborhood is awash with radiation that would fry puny Terran electronics in minutes. 

These two spacecraft are fairly similar.  But they will have different paths and schedules, which means that there will be many opportunities for simultaneous observations of Europa [1].  This will be far better data than from the usual single spacecraft mission.

(This may be very important if there are observations that “might” indicate life–corroborating data will be vital!)

There is a certain bit of confusion around the name ‘Europa’.  Both spacecraft will visit Europa, and one of them is sent from Europe (ESA).  In the US, the US spacecraft is “The Europa Clipper” reflecting the destination.  In Europe, the US probe may be called “The American Clipper”, reflecting its origin.

The main question for me is, “will I live long enough to see the results?”  You youngsters out there are lucky—you are likely to be here when these spacecraft report back.  Geezers like me have to be acutely aware that these missions are getting to be out at the edges of our operational lifetime. 

Fingers crossed, I should still be around, but it’s going to be a close run thing.  : – (

Anyway…Ice Worlds, Ho! Hope to be here to see it!


  1. Jonathan Amos, Europe’s mission to Jupiter’s icy moons ready for launch, in BBC News – Science, January 20, 2023. https://www.bbc.com/news/science-environment-64336398
  2. Gretchen McCartney, Karen Fox, and Alana Johnson, NASA’s Europa Clipper Spacecraft Kicks Assembly Into High Gear, in NASA – Europa Clipper, August 15, 2022. https://www.nasa.gov/feature/jpl/nasa-s-europa-clipper-spacecraft-kicks-assembly-into-high-gear