Greenland is melting. Each summer sees the ice retreat farther, each winter produces less snow and ice to replace the summer melt. We are on course for an ice free summer in Greenland, possibly in a few decades.
This fall saw a warm spell in August, unusually warm for that late in the summer. The effects were visible from outer space. As NASA’s Kathryn Hansen described it, the surface of the Humboltdt Glacier in northwest Greenland was turned into “a mishmash of ice, firn, melt, and dirt.” [1]
LANDSAT images of Humboldt Glacier, Greenland, August 18, 2023 and August 27, 2023 (From [1])
There is relatively little snow from last year showing. There is old snow, ice (packed from many years ago), slush, water, and bare dirt. This is what a glacier looks like when it is melting away.
The late warm spell means that summer was longer, and also means that next winter is correspondingly a couple of weeks shorter. The melted snow and ice will not be fully replaced this coming year.
There has been a lot of interest in rewilding, which basically goes beyond reintroducing threatened or missing species, to recreating whole ecosystems. For me, reintroducing Bison to tribal lands is the iconic effort. And it will end up regenerating a wild prairie, where numerous plants and animals flourish. These may not be exactly the same prairie as before the European disturbances, but it will be a self-sustained ecology.
In a similar vein, people are working to reintroduce beavers, especially to mountain watersheds. These animals were the great hydro engineers of North America, modifying vast areas, controlling water resources, and, many would say, creating ecosystems. Wiping out the beavers and removing their watery homes had many side effects, not least the loss of water supplies and habitats, which were no longer held by beaver ponds.
Reintroducing beavers involves some wonderful techniques. Building fake beaver dams (Hey, beavers! Look! This is a great place for a dam!) Also, tossing sticks in the water down stream. (Look at all this tasty food! Come see where it came from!)
Restoring beavers to wild streams is good for the rodents, but also is good for fish and other wildlife. It also builds a lot of healthy, green vegetation, widening the riverscape and improving the whole area [3]. It also retains the spring runoff longer, effectively increasing the water supply for the whole area.
This summer, NASA reports some satellite images show these beaver created green space [2]. Yes, they are big enough to be seen from space!
Another remarkable thing is how well the beaver habitats survive wild fires. These areas become important refuges for wildlife, and surely help the area survive and recover from fire damage.
As Kaitlin Carpenter discusses, monitoring these rewilding efforts is not so easy[1]. Going out to visit beaver streams is laborious and time consuming. (Heck, once they get going, you never know exactly where beavers will move next.)
NASA is encouraging and enabling the use of satellite imagery to monitor the status of these beaver areas. Satellite imagery is available all the time, and it shows a continuous record of ow things change. It also covers wide areas, including everything, not just the specifically targeted area.
(The New York Times takes pleasure reporting on trials and troubles from Florida (and California, and Texas. Etc.) : – ))
This month Rebecca Carballo reports on a large blast of Sahara desert dust that has drifted across the Atlantic and likely will be over Florida [1]. (I’m sure that the Internet will be able to spin this into a story about how ‘those Saharans aren’t managing their desert right’.)
Actually, Saharan dust doesn’t usually drift as far north as Florida. It generally falls over the Amazon basin, providing nutrition for the forest there. It’s reasonable to speculate that this cross-ocean river of nutrients has been an important factor in the long term evolution of this ecosystem.
To me, it’s really cool to realize that “wasteful” erosion which strips away soil from Northern Africa is actually regularly redistributing it onto rich forests in South America!
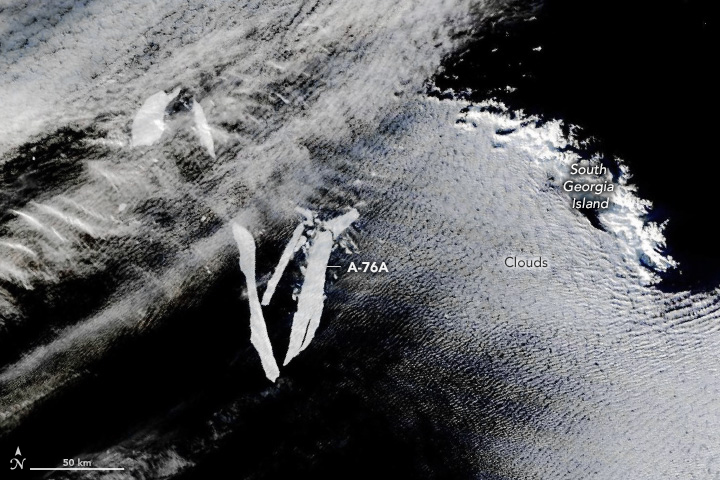
Iceberg A76 split off from its Antarctic ice shelf just over two years ago, heading out into the Weddell sea. At birth, she was the largest iceberg ever recorded. She’s been drifting north since then, melting away in the relatively warm Atlantic.
This spring (which is the end of the southern summer), the largest remaining fragment is breaking up off South Georgia [1]. This area sees plenty of floating ice from the south, and a lot of bergs melt and break up near South Georgia.
May 24, 2023. Image Credit: NASA Earth Observatory image by Wanmei Liang, using MODIS data from NASA EOSDIS LANCE and GIBS/Worldview. (From [1])
Given the enormous size of A76, it has had a slightly surprising short lifetime. Other bergs have lasted longer. But A76 has apparently caught some fast currents which drove her north rather quickly, and that’s where icebergs melt.
As noted before, icebergs calving off ice shelves is normal, and not necessarily related to climate change. Since we have pretty limited historic data about southern icebergs, it is hard to say whether the behavior is changing or not. A76 was the largest known iceberg, but we have very few measurements before the satellite age, so who knows what big bergs no one saw.
In any case, calving icebergs don’t affect sea level because the ice shelf is floating on the ocean already. Of course, if an ice shelf breaks up completely, releasing glaciers on land to flow faster, this could eventually result in depositing more ice into the ocean, raising sea level.
We know that the ice is melting everywhere on Earth. But that doesn’t mean we understand exactly how the cryosphere works.
A case in point is the ice of Antarctica. Of which there is a lot. A whole continent covered with ice and snow, in some places as deep as the ocean floor. A. lot. Of. Ice.
All this ice isn’t just sitting there. It is building and shrinking, and moving. Much of it eventually slides into the ocean, and breaks off into bergs.
In the last fifty years, “the satellite age”, we have been able to observe these processes more consistently. But we still don’t know what “normal” behavior is. Which means we can’t say for sure what may be changing due to warming conditions.
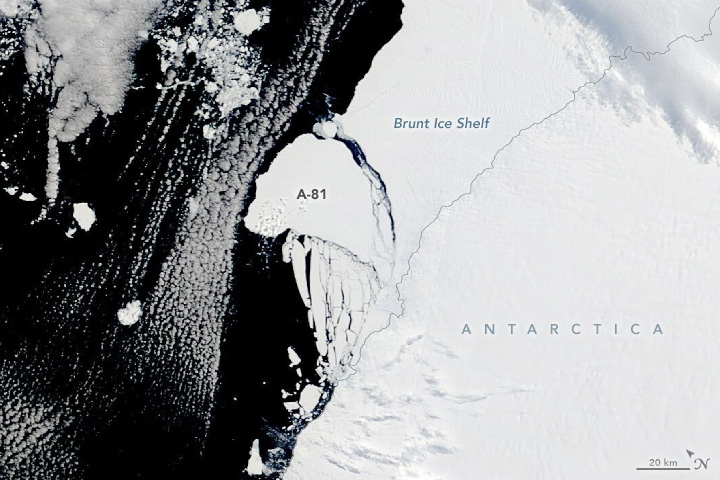
This month a new iceberg, tagged A-81, broke off from the Brunt ice sheet into the Weddell Sea [1]. This area has been under close observation for quite a while, and NASA captured plenty of before and soon after pix.
The action involve a large crack, charmingly tagged “Chasm 1”, that first appeared in the 1970s. After years of quiescence, it began to grow in 2012. Since then, other cracks appeared and another berg calved nearby. As Chasm 1 raced along at 4km / year, the British Antarctic Survey’s Halley Station had to be moved out of the way.
The crack finally reached the ocean this January, creating the new, 1559 km sq A-81.
January 24, 2023.NASA Earth Observatory images by Lauren Dauphin, using MODIS data from NASA EOSDIS LANCE and GIBS/Worldview and Landsat data from the U.S. Geological Survey.(From [1])
January 24, 2023
Isn’t it cute?
As Hansen’s article makes clear, these events are part of the natural behavior of the ice. As the ice flows out over the sea at the coast, the outer edges thin and “are stressed by storms and tides and thin as they are melted from above or below, ultimately making them more prone to forming rifts and breaking away.”
While we got a pretty good record of this start and stop process this time, no one really knows if this is typical, or if the recent sprint is related to warming of air and sea. Obviously, we’ll be keeping an eye on this area to see what happens next.
Greenland is melting, especially at the coasts where ice meets the ocean. We know that ice is thinning and receding at the edges, but it’s a lot harder to measure farther inland.
This winter, researchers from Denmark and other countries report a study of one important case, the Northeast Greenland Ice Stream [1]. Using satellite data, remote sensing, and ground receivers, the study estimated the position and movement of the ice stream from 2007 to 2021. This covers the ice stream hundreds of kilometers inland, including the entire length of two ocean terminating glaciers.
The integrated model indicates that the ice is thinning and accelerating faster than earlier models. There was a major event in 2012, when an ice shelf collapsed. This new study shows “that extensive speed-up and thinning triggered by frontal changes in 2012 have already propagated more than 200 km inland”. ([1], p. 727) I.e., when the ice at the ocean disappeared it released the glaciers to flow more quickly. This has had a rapid and detectable impact.
This is further evidence that Greenland’s ice is rapidly melting into the ocean. This will contribute to rising mean sea level. This study calculates that “this marine-based sector alone will contribute 13.5–15.5 mm sea-level rise by 2100 (equivalent to the contribution of the entire ice sheet over the past 50 years)” ([1], p. 727) Overall, they predict much higher sea level changes than previous studies.
This is becoming a pattern. Every new study improves the measurements of the ice, and every new measurement increases the estimates of ice loss. The bottom line is that Greenland is melting really fast, pretty much everywhere. In a few decades, there will be no permanent ice on Greenland at all.
Shfaqat A. Khan, Youngmin Choi, Mathieu Morlighem, Eric Rignot, Veit Helm, Angelika Humbert, Jérémie Mouginot, Romain Millan, Kurt H. Kjær, and Anders A. Bjørk, Extensive inland thinning and speed-up of Northeast Greenland Ice Stream. Nature, 611 (7937):727-732, 2022/11/01 2022. https://doi.org/10.1038/s41586-022-05301-z
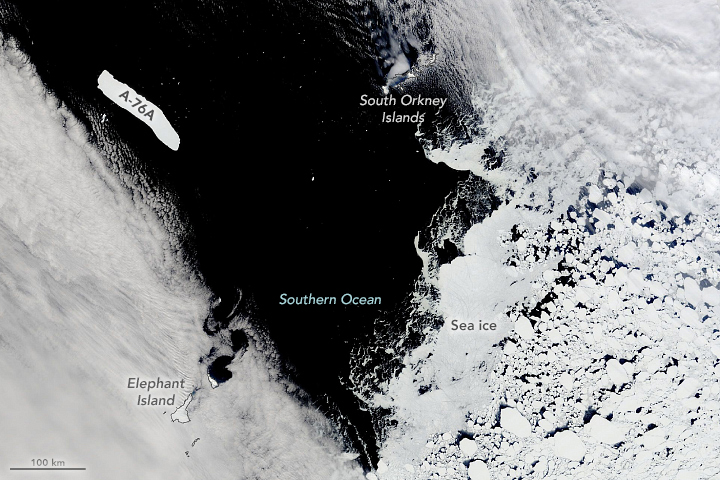
Most icebergs break up and melt away quickly, though not without travelling thousand of kilometers. But A-76 is big ol’ girl, and apparently she’s still wandering.
This month, NASA published images of A-76A (the main chunk of A-76) cruising in the Drake Passage, 1000 kilometers from where she started [1]. Not only that, but she’s pretty much the same size.
Image Credit: NASA (From [1])
This sighting is fairly remarkable, since that area is pretty stormy and rough seas, so A-76A must have survived quite a beating. It also must have survived the relative warmth of last summer. The berg is now coming out of her second winter and emerging into her second summer, which is pretty darn old for an iceberg!
Who knows where she will wander to, or how long she till last? We’ll stay tuned.
When—not if—Greenland’s ice cap completely melts into the oceans, it will cause a 7 meter rise in mean sea level. Glub! No…you probably can’t engineer around that, so your coastal city is gone. (Miami, this means you.)
This summer European researchers report an estimate of the ice mass of Greenland’s peripheral glaciers over the satellite era, 2003-2021 [2]. Overall, they estimate that ice mass is being lost 4 times faster now as at the beginning of the measurements (which was only 20 years ago!)
This study was based on laser altimetry from ICESat and ICESat-2. The height of the ice is measured, which is used to estimate the volume of the ice, and therefore the mass. The researchers used all available data to construct a time series for 500 x 500 meter boxes. (Phew! That’s a lot of data!)
At this granularity, the glaciers of Greenland are a complicated fractal-y map, with bits of ice, land and water all mixed together. The results are complicated, too. Some places lost ice slowly, others lot it fast, and some locations gained ice at times. Adding everything together, the ice is melting fast.
The researchers note that even though this is a small part of Greenland’s ice, the relatively rapid losses mean that these glaciers contribute disproportionately to overall changes. And specifically, these rapidly changing areas are an important part of the overall sea level rise.
Which means that sea level will probably rise sooner rather than later. (And, of course, rising sea level will probably melt the peripheral glaciers faster. Etc.)
It is important to note that this kind of smaller scale, “fractal” geography is really hard to measure and model. It’s complicated, and each nook and cranny is influenced by the weather, tides, etc. in its own local way. For this reason, this study is a really important contribution.
It is also true that measures and models will probably change in the future, if more and finer grained data become available. The researchers are aware of this, and have tried to make a lower bound estimate of ice losses. Time will tell how close this study is.
Shfaqat A. Khan, William Colgan, Thomas A. Neumann, Michiel R. van den Broeke, Kelly M. Brunt, Brice Noël, Jonathan L. Bamber, Javed Hassan, and Anders A. Bjørk, Accelerating Ice Loss From Peripheral Glaciers in North Greenland. Geophysical Research Letters, 49 (12):e2022GL098915, 2022/06/28 2022. https://doi.org/10.1029/2022GL098915
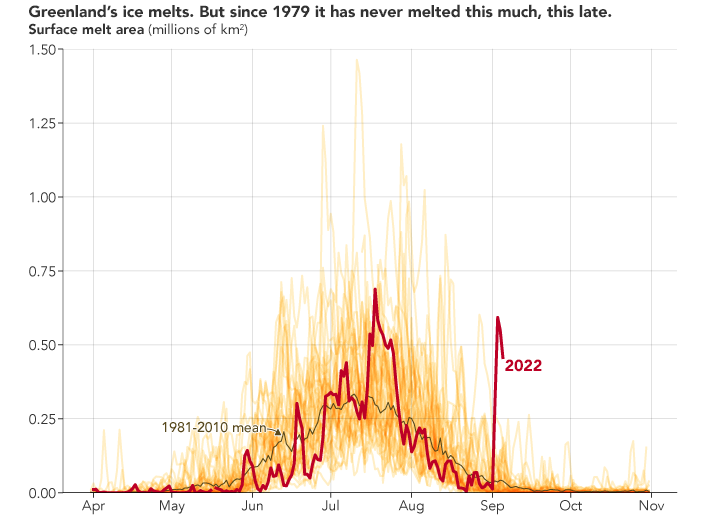
This was a hot summer in Europe and North America, so I guess I shouldn’t be surprised that there has been hot weather in Greenland as well.
The summer melt usual ends by September, with decreasing sunlight. This year, a warm, wet front pushed up over Greenland in the first days of September, creating a late season warm spell. Very warm.
It looks like the northern half of Greenland was 15 degrees C above average, above freezing and melting more ice [1]. This is a record “melt area” for September. ( Actually, there aren’t many direct reports from the ice cap, but NASA’s model gives a reasonable estimate.)
(From [1])
Researchers note that this obviously melts some of the surface, and also likely delays the first accumulation of this winter. The delayed onset could mean that this winter’s accumulation will be smaller offsetting less of this year’s melt, so the total accumulation of ice will decrease more rapidly.
However, it’s not easy to predict exactly how much ice will be lost or when. The speed of glaciers, storms, the presence of pools and rivers on top and below the ice all influence the growth or loss of ice. And, at base, ice builds up after winter snows, and retreats in summer thaws.
Theoretical modelling is complemented by expert intuitions and by observations from the surface, air, and space. The former generally foresees faster melting and sea level rise than the models predict—with greater uncertainty.
Observational data can document the past and current situation, but projecting the future from the past is hard. I mean, data is jiggly, and potentially voluminous. And there are lots of ways to interpret it, which may give different views.
This summer, European researchers report a new estimate of the future of Greenland’s ice based on satellite imagery combined with other measures [1]. In particular, they estimate the volume of the ice, i.e., the loss and gain of ice mass, based on visible ice, ice flow, and snow fall. (The researchers note that this technique has been used for local estimates of glaciers, this research scales it up to the entire surface of Greenland.)
The results project that, based on recent years, Greenland will contribute over 27 cm to mean sea level regardless of future developments. I.e., they estimate that 27 cm of SLR is already baked in. This is at the high end of other estimates. (Note that there is no estimate of when the sea level will rise.)
Satellite data is particularly interesting, because it covers everything, it is getting better every year, and because we have been collecting it for fifty years now.
As part of this celebration, Kathryn Hansen discusses a pair of images of northern Greenland, taken 50 years apart [3]. (Well, 49 years to be precise.) Despite differences in the two satellites, the images are easy to compare by eye.
The ice is still there, of course, but we can see that many smaller areas are gone, and some low lying glaciers have surged. And the larger areas have a lot of grey around the edges, which is older, dirtier ice. All in all, the two pictures suggest that, at small scales, the ice is melting and flowing toward the sea.
Comparison of September 2, 1973 and August 20, 2022.(From [3]) Image Credit: NASA Earth Observatory images by Joshua Stevens, using Landsat data from the U.S. Geological Survey.
Jason E. Box, Alun Hubbard, David B. Bahr, William T. Colgan, Xavier Fettweis, Kenneth D. Mankoff, Adrien Wehrlé, Brice Noël, Michiel R. van den Broeke, Bert Wouters, Anders A. Bjørk, and Robert S. Fausto, Greenland ice sheet climate disequilibrium and committed sea-level rise. Nature Climate Change, 2022/08/29 2022. https://doi.org/10.1038/s41558-022-01441-2