
One of the most noticeable trends on the planet is the melting of the north pole ice cap. In my lifetime, the “permanent” ice on the Arctic Ocean has retreated steadily, to the point where there is open water every summer. When I was a lad, this was something that happened in the far past, and might in the far future. Well, boys and girls, the far future is here, now.
OK, we’re pretty sure the ice cap is changing, and it seems to be retreating. But measuring it hasn’t been easy, and theory based predictions have been highly uncertain [1]. A big limitation has been measuring ocean ice with satellites.
Satellites can see the surface, but it isn’t trivial to determine where the “edge” of floating ice might be. The boundary is ragged, and, worse, there is water on top of the ice (sometimes), there may be a thin sheet of ice (e.g., at night), and floating chunks. It’s messy, and you can get vastly different estimates if you make different definitions.
Researchers have developed convintional standard definitions for many questions, like, how thick does the ice have to be to be counted as part of the sheet? When does slushy water become watery ice? Analysis of satellite data has to be done very carefully to make sure the definitions are clear and consistently applied.
Beyond estimating the extent of the ice cap (2D area), what we really want to know is how much ice there is, the volume of ice. This involves the third dimension, depth. In the case of the Arctic Ocean, this is very important because it is suspected that the ice is thinning as well as retreating. If so, then the mass of the ice, the total amount of ice, may be decreasing more, and more quickly, than the area is. Thinning ice also may result in sudden retreats in area as thinner ice melts away in a short period.
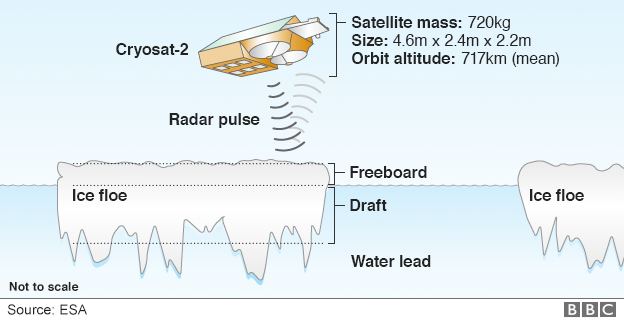
The basic technique for estimating the volume of the ice with a satellite is to use radar (Cryosat-2) or lasers (Icesat-2) to detect the height of the ice and the height of water or cracks. So, height times extent equals volume. Unfortunately, this technique doesn’t work as well when the ice is covered with snow or ponds, as it often is in the summer [1].
This summer, an international team of researchers report a new analysis method that yields an improved estimate of ice volume all year round from Cryosat-2 [2]. Among other tools, they used—wait for it—deep learning!
If I understand correctly, the analysis uses satellite measurements of the surface conditions (melt water on the ice, “roughness”, sea ice movement, estimates of snow coverage) to estimate the bias introduced into the radar measures of height. (The details exceed my own understanding of radar signal processing.)
Combined with other data, the improved measurements of ice volume will improve short term forecasts of ice conditions, and also should improve theoretical models of the long term climate.
- Jonathan Amos, Satellites now get full-year view of Arctic sea-ices, in BBC News – Science, September 16, 2022. https://www.bbc.com/news/science-environment-62904939
- Jack C. Landy, Geoffrey J. Dawson, Michel Tsamados, Mitchell Bushuk, Julienne C. Stroeve, Stephen E. L. Howell, Thomas Krumpen, David G. Babb, Alexander S. Komarov, Harry D. B. S. Heorton, H. Jakob Belter, and Yevgeny Aksenov, A year-round satellite sea-ice thickness record from CryoSat-2. Nature, 609 (7927):517-522, 2022/09/01 2022. https://doi.org/10.1038/s41586-022-05058-5

One thought on “Measuring the Arctic Ice Cap”