Category Archives: Anthropocene

What’s Happening in East Antarctica?

We’ve all been concerned about the rapid melting of all the ice in Greenland, and the rapid thinning of the Arctic ice sheet.  When—not if—these areas melt completely, it will raise mean sea level a bit.  Knee deep, or maybe waist deep.  Significant, but survivable.

And we’ve been watching West Antarctica, which seems to be melting faster these days.  If West Antarctica eventually melts completely, that would be another 3+ meters of sea level.  Over your head.  Up to the second story.  Glub.  Pretty bad for coastal areas.

Until recently, East Antarctica has seemed stable.  This is the big one, with 4/5 of the worlds ice.  If West Antarctica were to melt down, that would mean a rise of 50 meters, up to the 10 floor, in mean sea level.  Pretty much game over for human civilization. 

This spring Alec Luhn discusses recent signs of instability in East Antarctica, which are, *ahem*, concerning to say the least [1]. 

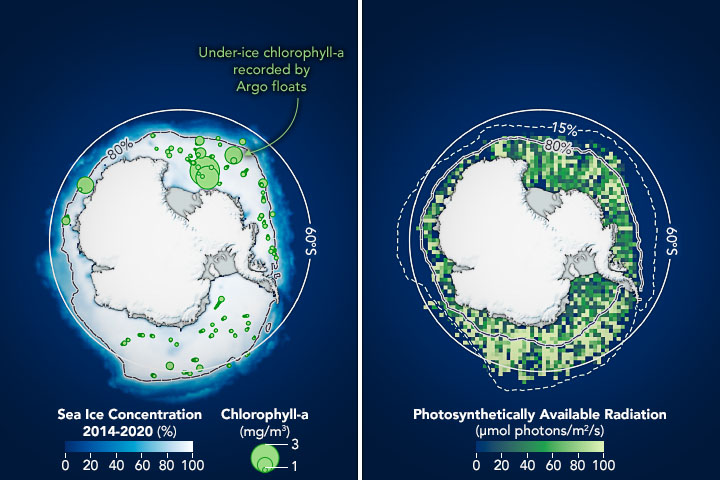
In part, the new concerns reflect an increase in available data.  This area is extremely difficult to access, so there has been very little information about the ice, underlying rock, and the important coast lines under the sea ice.  All the theoretical models in the world tell us nothing in the absence of adequate data.

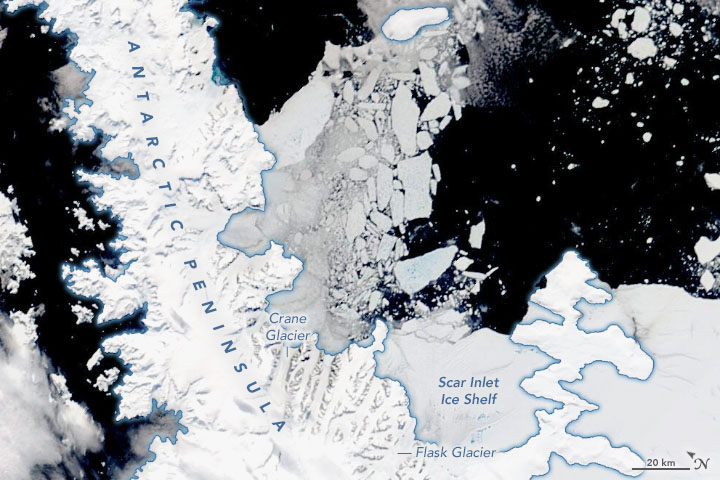
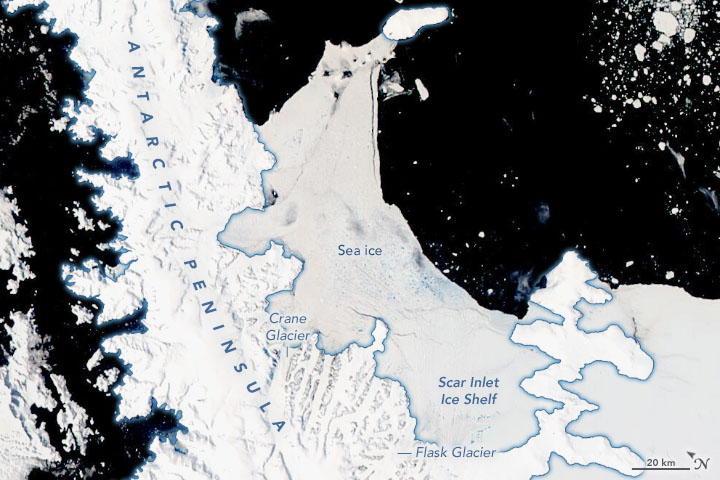
One worrying part is that the sea ice is shrinking, which releases glaciers to slide faster to the ocean. When the ice from glaciers hits the ocean, it breaks off and eventually melts—raising sea level (and also altering salinity, warming the ocean, and other changes). This process feeds back, further warming and speeding melting.

The question is whether there is a tipping point, after which the melting accelerates irreversibly.  And if so, have we already crossed it?

The good news is that this is all geology.  Even if Antarctica crashes, going into irreversible rapid melt down, it will take decades.

The bad news is that we still have a lot of missing data for this part of the world.  Pretty much every study finds surprising things, most of them alarming.  Rapidly retreating grounding lines.  Huge underground canyons under the ice, filling with warming sea water.  Giant lakes under the ice.  Who knows what awaits discovery?

There are a number of expeditions in progress which will return a lot more data about the ice and oceans in East Antarctica. I expect there will be surprises, and most of them will not be good news.


  1. Alec Luhn, Why East Antarctica is a ‘sleeping giant’ of sea level rise, in BBC Future, March 12, 2023. https://www.bbc.com/future/article/20230309-climate-change-the-sea-level-rise-locked-in-east-antarctica

Dam Removals Coming for the Klamath River

In the early twenty first, we see efforts to restore nature, literally undoing some of the changes humans have wrought. In addition to re-wilding, restoring species, and restoring land ownership to indigenous people, dams are being removed from waterways.

In a lot of cases, this really amounts to just making crumbling infrastructure safe before it collapses catastrophically.  But some projects are quite ambitious, aiming to restore the ecology of a significant river.

One of the largest such projects is on the Klamath River in US.  In 2023-2024, four dams will be removed from the lower reaches of the Klamath, restoring free flow to hundreds of kilometers of river [2].  (Note that the river system will still have seven dams.)

Removing dams will also involve rebuilding roads and other infrastructure.  Overall, this is an expensive project, in the same ballpark as building dams in the first place.  Sigh.

A tiny sliver of the funding will go to scientific measurements of the river system, to document the results and inform further decision making (e.g., [1]).  The teams are rushing to gather as much “before” data as possible, and then will measure the new, “free”, river.

The bad news is that most of the funding is going to infrastructure.  Not much is going to science, and there isn’t really a plan for sustained monitoring.

The good news is, that unlike when the dams were built, we have a pretty good idea of how to do these studies, and we have the ability to create computer models to understand the effects of alternative interventions.

Tara Lohan points out the important role that the Yurok tribe (who have been busy on other fronts as well), who have agitated for the dam removal for a long time.  The tribe is hoping to restore the health of salmon and other fish in the river, which are an important food source.  The Yurok and others are collaborating with academic researchers, incorporating traditional knowledge of the ecosystem with the new measurements. 

These collaborations also aim to keep the indigenous people in the decision-making process for future interventions.  (We’ll see about that—the US has never yet kept any promise to Indians.)

In any case, the dams are coming down, and the Klamath is going to flow free.  It will be intersting to see what happens.  What will the new version of the river look like?  Will there be more or fewer floods?  Will the salmon return, as hoped? 

We shall stay tuned.


  1. California Water Science Center, Klamath Dam Removal Studies Active, in USGS – California Water Science Center, November 3, 2022. https://www.usgs.gov/centers/california-water-science-center/science/klamath-dam-removal-studies
  2. Tara Lohan, Klamath Countdown: Researchers Hustle Before Largest Dam-Removal Project Begins, in Resilience, February 14, 2023. https://www.resilience.org/stories/2023-02-14/klamath-countdown-researchers-hustle-before-largest-dam-removal-project-begins

Greenland is Melting Inland Too

Greenland is melting, especially at the coasts where ice meets the ocean.  We know that ice is thinning and receding at the edges, but it’s a lot harder to measure farther inland.

This winter, researchers from Denmark and other countries report a study of one important case, the Northeast Greenland Ice Stream [1].  Using satellite data, remote sensing, and ground receivers, the study estimated the position and movement of the ice stream from 2007 to 2021.  This covers the ice stream hundreds of kilometers inland, including the entire length of two ocean terminating glaciers.

The integrated model indicates that the ice is thinning and accelerating faster than earlier models.  There was a major event in 2012, when an ice shelf collapsed.  This new study shows “that extensive speed-up and thinning triggered by frontal changes in 2012 have already propagated more than 200 km inland”. ([1], p. 727)  I.e., when the ice at the ocean disappeared it released the glaciers to flow more quickly.  This has had a rapid and detectable impact.

This is further evidence that Greenland’s ice is rapidly melting into the ocean.  This will contribute to rising mean sea level.  This study calculates that “this marine-based sector alone will contribute 13.5–15.5 mm sea-level rise by 2100 (equivalent to the contribution of the entire ice sheet over the past 50 years)” ([1], p. 727)   Overall, they predict much higher sea level changes than previous studies.

This is becoming a pattern. Every new study improves the measurements of the ice, and every new measurement increases the estimates of ice loss. The bottom line is that Greenland is melting really fast, pretty much everywhere. In a few decades, there will be no permanent ice on Greenland at all.

Wow. And, “glub”.


  1. Kathryn Hansen, Greenland’s largest ice stream is expected to contribute more to sea level rise than models previously indicated, in NASA Earth Observatory – Image of the Day, January 7, 2023. https://earthobservatory.nasa.gov/images/150801/thinning-of-the-northeast-greenland-ice-stream
  2. Shfaqat A. Khan, Youngmin Choi, Mathieu Morlighem, Eric Rignot, Veit Helm, Angelika Humbert, Jérémie Mouginot, Romain Millan, Kurt H. Kjær, and Anders A. Bjørk, Extensive inland thinning and speed-up of Northeast Greenland Ice Stream. Nature, 611 (7937):727-732, 2022/11/01 2022. https://doi.org/10.1038/s41586-022-05301-z

Arctic Report Card

I have noted many times, we are scienceing the hell out of the polar regions, throwing everything we can at measuring and modelling these critical regions which are rapidly changing.

In December, the US National Oceanographic and Atmospheric Administration (NOAA) issues an annual “report card” summarizing conditions in the Arctic [2].  This is a brief summary of overall findings from a range of measurements and studies of the Arctic, including satellite, airborne, surface, and submarine samples, as well as data analysis and theoretical modelling.

The 2022 report card covers a lot of material, but the headlines make the main point:  the Arctic is steadily warming (air, land, and water), which is shifting seasons and disrupting life. 

One large effect is that the Arctic is wetter, with more snow and rain falling [1].  This contributes to melting of permanent ice and snow, and also “greens” both the land and ocean, fostering the growth of some plants and plankton.  These effects are dramatically altering the ecosystems, perhaps in ways that are difficult to anticipate.

The report card notes that, as discussed elsewhere, Geese are doing fine.

“In 2022, despite an outbreak of highly pathogenic avian influenza in North America and variable spring weather conditions, the population sizes of most Arctic geese remained at or above historical levels.”

The top headline makes two very telling points. 

One is that this report makes clear “the value of diverse observations”.   Actual measurements.  What a concept!

The second is that the climate and related events “are becoming increasingly difficult to assess within the context of what has been previously considered normal.”  Quite.


  1. Jonathan Amos, More snow and rain is falling in the Arctic, in BBC News – Science, December 14, 2022. https://www.bbc.com/news/science-environment-63967630
  2. NOAA. Arctic Report Card. 2023, https://www.arctic.noaa.gov/Report-card.

NOAA. Arctic Report Card, Jonathan Amos, More snow and rain is falling in the Arctic,

How Much Plankton is Under the Antarctic Sea Ice?

The Arctic and Antarctic oceans are covered with ice all winter, and in some places all year round (at least until recent melting).  These areas are little explored by land bound tropical primates, and have generally been assumed to be empty of light and life. 

In recent years, observations have shown that the Arctic Ocean has considerable amounts of phytoplankton living under the ice, not just in ice free locations.  This indicates that there is more light penetrating the ice than earlier assumptions.  It is possible that this reflects effects of anthropocentric changes to the northern sea ice letting in more light, though there are indications that these plankton blooms were present decades ago.

But what about the southern sea ice around Antarctica?  The ice in the south is more snow covered than in the north, and therefore higher albedo.  On the other hand, it thins and breaks up in the spring, and, of course, anthropogenic changes are surely impacting the south.

This fall researchers from several institutions report substantial amounts of phytoplankton even before the spring ice retreated [2].  The study used data from ICESat-2 to map the ice and water samples taken by Argo floats.  The water samples can indicate phytoplankton blooms, though the Argo floats do not measure close to the surface where the most phytoplankton would be.  So these samples under estimate the presence of plankton.

The study also modelled the light and ice conditions in the area.  The theoretical model suggests that there is enough light under the ice, which presumably could support widespread phytoplankton blooms.

These conclusions are plausible, though there are relatively few measurements in this inaccessible region.  The researchers urge surface ship studies to look carefully for the signs of plankton blooms. They remark that earlier expeditions may have missed this difficult to detect phenomenon.

These results along with the related studies of the Arctic suggest that the polar sea ice may be home to considerably more biological activity than realized.  This might impact global models of the oceans and Carbon. 

(From [1])

  1. Michael Carlowicz, New evidence shows that a sufficient amount of daylight penetrates the ice to sustain blooms of floating, plant-like organisms, in NASA Earth Observatory – Image of the Day, November 29, 2022. https://earthobservatory.nasa.gov/images/150671/phytoplankton-may-be-abundant-under-antarctic-sea-ice
  2. Christopher Horvat, Kelsey Bisson, Sarah Seabrook, Antonia Cristi, and Lisa C. Matthes, Evidence of phytoplankton blooms under Antarctic sea ice. Frontiers in Marine Science,  2022. https://www.frontiersin.org/articles/10.3389/fmars.2022.942799

The State of the Birds (North America)

Every few years, the North American Bird Conservation Initiative publishes a report on The State of the Birds [1].  This report is compiled by a coalition of “government agencies, private organizations, and bird initiatives led by NABCI (North American Bird Conservation Initiative)”.

The 2022 report shows that over the last 50 years, a few species have thrived, some have been conserved, and many others have declined dramatically in numbers cite [2].  The report identifies 90 species on “Alert”—species that are not currently protected that have lost 50% or more of their numbers in the last 50 years.  Of these, 70 are tagged as at a “Tipping Point”—projected to lose another 50% in the coming 50 years.

The tipping point species are high priority targets for study, preservation, and conservation efforts.

For anyone who is paying attention, there is nothing surprising in this report.  Birds compete with humans for living space and food resources, and it’s hardly an even competition.  Humans are winning, taking over and modifying the surface of the planet, land and sea.

In addition, the last fifty years have seen an acceleration of global effects, including pollution and climate change.  These have adverse effects on birds and habitats far removed from the original human sources.

The upshot is that wild birds are declining almost everywhere, due to multiple causes.

Humans have also had positive effects, especially through deliberate conservation efforts.  Waterfowl have held their own, largely due to a long history of conservation.  Other species of special interest to humans, such as condors and eagles, have survived and even recovered via extensive human intervention.

And then there is the wildest outlier in the dataset.

Goose populations are near historic highs, largely due to successful adaptation to agricultural and urban landscapes.  ([1], p.11)

those damned geese!

I don’t know about you, but my area is overrun by “wild” geese, to the point that it is a serious nuisance.  As the report indicates, geese are multiplying because they have adapted to humans. No kidding!

Even if we don’t care about birds in general, or specific endangered species (and I certainly care about birds, myself), they are very visible indicators of the overall health of the ecosystem.  When the birds disappear, that means that plants, insects, microbes, and everything else are probably disappearing, too.  Which is bad, because humans are eventually part of “everything else”.

Humans can take effective steps to save and bring back birds, which will improve life for “everything else”.  The member organizations of NABCI are working to create and sustain efforts, i.e., these folks know how to do it. So, this report serves to identify high priority targets for new or larger programs.

(I’ll note that saving birds generally involves doing stuff that’s good for people, tough not necessarily good for short term profits.)


The bottom line is: The state of the birds is…totally in the hands of humans. 


  1. North American Bird Conservation Initiative, The State of the Birds, United States of America, 2022. North American Bird Conservation Initiative, Ithaca, 2022. https://StateoftheBirds.org
  2. North American Bird Conservation Initiative, U.S. State of the Birds Report Reveals Widespread Losses of Birds in All Habitats–Except for One, in State of the Bidrds – Newsroom, October 12, 2022. https://www.stateofthebirds.org/2022/news-room/

Study of Atmospheric Rivers And Antarctic Ice Shelves

And speaking of melting sea ice

Just how does a long stable ice shelf suddenly melt and break up?  In this case, we are spoiled for choice.  Warmer water, warmer air, changes in storms, changes in currents, other stuff.  Any and all can weaken ice.  Plus the effects can feed back in different ways over time.  And each shoreline has its own peculiarities.

This spring researchers report a study of two “large and dramatic collapses” of Antarctic ice shelves, Larsen A in 1995 and Larsen B in 2002 [2].  (We’re working on Larsen C now.) 

The study identified “atmospheric rivers” (AR), “narrow long bands of enhanced moisture fluxes originating from the mid-latitudes and sub-tropics” ([2], p. 2).  These patterns were found in satellite data recording moisture and the flow of moisture over large areas.  These AR occur frequently, and especially large ones reach Antarctica, bringing a burst of warm, wet air.

They found that extreme AR are associated with extreme conditions on the ice shelves, temperature, melting, disintegration, swells.  These winds were followed by calving and breakup of the Larsen ice shelves (observed in other satellite imagery).  They also were associate with changes in onshore Foehn winds that lead to ice breakup.

These results are intriguing, though far from complete. These bursts are, as the researchers say,  “an event that is temporally minuscule in comparison to the age of the ice shelf” ([2], p. 11), so there is more to the story.

If nothing else, it looks like these bursts of warm air may be the last straw, the trigger than sets off a large scale disruption of already weakened ice.  Other changes, including water temperature, currents, and long term precipitation patterns probably led up to these dramatic events.

The researchers also speculate that these AR events, which are fairly common overall, “only become detrimental above a certain average temperature threshold” ([2], p. 9).  If so, then increases in overall atmospheric temperature extremes may lead to more AR triggered breakups.


  1. Henry Fountain, Scientists Solve an Antarctic Puzzle, in New York Times. 2022: New York. https://www.nytimes.com/2022/04/14/climate/antarctic-ice-shelves-atmospheric-rivers.html
  2. Jonathan D. Wille, Vincent Favier, Nicolas C. Jourdain, Christoph Kittel, Jenny V. Turton, Cécile Agosta, Irina V. Gorodetskaya, Ghislain Picard, Francis Codron, Christophe Leroy-Dos Santos, Charles Amory, Xavier Fettweis, Juliette Blanchet, Vincent Jomelli, and Antoine Berchet, Intense atmospheric rivers can weaken ice shelf stability at the Antarctic Peninsula. Communications Earth & Environment, 3 (1):90, 2022/04/14 2022. https://doi.org/10.1038/s43247-022-00422-9

The Sea Ice Is Melting (Almost) Everywhere

While the overall summer extent of sea ice is trending toward a record minimum this year, but some places are not changing very much.

After the drama of iceberg A68, it is important to remember that the break up of ice sheets and flow of glaciers is highly variable.  So, we note that, unlike the famous A68, Iceberg B-22 has gone nowhere in the last decades [2]. This is not to say that the Thwaites Glacier is not melting, in fact it is shedding a lot of ice in smaller, unnamed chunks—just like other parts of Antarctica.  While the overall sea ice is near record low this year, not every big chunk goes wandering.

At the other pole, we have seen record and near record summer sea ice.  We have also seen record low winter extent of sea ice in the north–except in the Bering Sea between Siberia and Alaska [4].  This year has actually seen more than average sea ice coverage in the area.

One reason is that local wind and weather can have a bigger effect than background trends.  This year, a period of cold weather in February rapidly iced up the Bering Sea.  Obviously, the weather could change, and the ice will change.

These variations and local cases reflect that the planet is large and the oceans and atmosphere are complicated.  All the more reason to worry about the clear and consistent warming of the planet and melting of the ice. 

It takes a lot to actually create the kind of warming trend we have seen, and it will take a lot to moderate that trend.


  1. Henry Fountain, Sea Ice Around Antarctica Reaches a Record Low, in New York Times. 2022: New York. https://www.nytimes.com/2022/02/23/climate/antarctica-sea-ice-arctic.html
  2. Kathryn Hansen, In the span of 20 years, Iceberg B-22A has strayed just 100 kilometers from its birthplace at Thwaites Glacier., in NASA Earth Observatory – Image of the Day, March 1, 2022. https://earthobservatory.nasa.gov/images/149522/antarctic-berg-grounded-for-decades
  3. National Snow and Ice Data Center, Charctic Interactive Sea Ice Graph, in Arctic Sea Ice News & Analysis, 2022. https://nsidc.org/arcticseaicenews/charctic-interactive-sea-ice-graph/
  4. Sara E. Pratt, Despite an overall trend of Arctic ice loss, the Bering Sea saw an expansion of sea ice due to a short-lived atmospheric-pressure pattern, in NASA Earth Observatory – Image of the Day, February 24, 2022. https://earthobservatory.nasa.gov/images/149498/a-sea-of-icy-variability

Lessons from Paleoclimates

The atmosphere and oceans are warming rapidly, and will continue to warm for many decades.  But this is hardly the first time our planet has been this warm, though it probably is the most rapid heat up ever. 

So, one way to think about it is that the planet is heading for “Pleistocene” conditions in a couple of decades, and “Miocene” conditions in fifty years or so [2].  Obviously, there won’t be Mammoths or sabre tooth cats, alas, but the overall environment could well resemble these ancient periods.

This is the idea behind a study of paleoclimates in the British Isles [1].  The research used fossil pollen to parametrize a climate model.  The models infer the Mean Annual Temperature and Mean Annual Precipitation, as well as related statistics.

The results indicate that Britain was warm and wet, warmer and wetter than now (as expected).  But conditions in Britain were milder than continental Europe.

The researchers argue that these reconstructions of past climate suggest likely future conditions in Britain.  So, for instance, these results suggest that the UK may experience mildly warmer and wetter weather in the coming century.

This sort of modelling is iffy, of course.  The fossil pollen records are sparse and hard to interpret precisely.  In addition, the models developed from contemporary data may or may not apply to earlier periods, it’s hard to know.  So, iffy data plus iffy models equals, what?

On the one hand, the results are quite plausible, which seems to indicate that the models are OK and the data is good enough to make sense.

On the other hand, saying that the overall temperature of the planet is similar to the Miocene is hardly a complete picture.  We know that the climate of Britain and Northern Europe are strongly influenced by the Atlantic currents.  If the currents change dramatically, then Britain and Europe could experience a much colder and drier climate, regardless of global averages.

The results of this study seem to imply that the currents must have been similar to now in the Miocene, at least during the warm periods studied.  If so, then those periods cannot represent what the climate will be like in the event of a major excursion of the Atlantic circulation.

In any case, these findings scarcely change our basic understanding: human activities are modifying the planet rapidly in ways that we don’t completely understand but know are likely to be harmful to humans and other living things. 


  1. M. E. Gibson, J. McCoy, J. M. K. O’Keefe, N. B. Nuñez Otaño, S. Warny, and M. J. Pound, Reconstructing Terrestrial Paleoclimates: A Comparison of the Co-Existence Approach, Bayesian and Probability Reconstruction Techniques Using the UK Neogene. Paleoceanography and Paleoclimatology, 37 (2):e2021PA004358, 2022/02/01 2022. https://doi.org/10.1029/2021PA004358
  2. Matthew Pound and Martha Gibson, We reconstructed Britain of millions of years ago to see what climate breakdown will involve, in Resilience, February 11, 2022. https://www.resilience.org/stories/2022-02-11/we-reconstructed-britain-of-millions-of-years-ago-to-see-what-climate-breakdown-will-involve/

Larsen B Ice Sheet Breakup

The ice is melting everywhere.

One place that seems to be melting especially rapidly is the Antarctic Peninsula.  Five years ago, the A68 iceberg broke off there and floated north. 

This winter, the Larsen-B ice sheet “suddenly” disintegrated [1].   Specifically, a large area of sea ice had been “embayed” since 2011, broke up within days in mid January. 

This is high summer in Antarctica, so conditions are warm-ish.  The sudden break up may have been pushed by sustained warm “foehn” winds blowing across the ice.

Larsen B Embayment Breaks Up, January 16, 2022 vs January 22, 2022. Image credit: Joshua Stevens. (From [1])

Satellite imagery shows that this area has been rapidly changing for the last 20 years, as an ice shelf has essentially disappeared.  The sea is full of ice chunks, and forms a shelf in the winter.  But overall, the current conditions offer much less resistance to the glaciers flowing into the sea, so the loss of ice on the peninsula is likely to accelerate.

For the record, melting sea ice does not change sea level, but ice flowing from land into the ocean does.  So, once again, glub!


  1. Kathryn Hansen, After more than a decade fastened to the coastline, a large expanse of sea ice broke away from the Antarctic Peninsula, in Earth Observatory – Image of the Day, February 2, 2022. https://earthobservatory.nasa.gov/images/149410/larsen-b-embayment-breaks-up