Tag Archives: Mathieu Morlighem

Greenland is Melting Inland Too

Greenland is melting, especially at the coasts where ice meets the ocean.  We know that ice is thinning and receding at the edges, but it’s a lot harder to measure farther inland.

This winter, researchers from Denmark and other countries report a study of one important case, the Northeast Greenland Ice Stream [1].  Using satellite data, remote sensing, and ground receivers, the study estimated the position and movement of the ice stream from 2007 to 2021.  This covers the ice stream hundreds of kilometers inland, including the entire length of two ocean terminating glaciers.

The integrated model indicates that the ice is thinning and accelerating faster than earlier models.  There was a major event in 2012, when an ice shelf collapsed.  This new study shows “that extensive speed-up and thinning triggered by frontal changes in 2012 have already propagated more than 200 km inland”. ([1], p. 727)  I.e., when the ice at the ocean disappeared it released the glaciers to flow more quickly.  This has had a rapid and detectable impact.

This is further evidence that Greenland’s ice is rapidly melting into the ocean.  This will contribute to rising mean sea level.  This study calculates that “this marine-based sector alone will contribute 13.5–15.5 mm sea-level rise by 2100 (equivalent to the contribution of the entire ice sheet over the past 50 years)” ([1], p. 727)   Overall, they predict much higher sea level changes than previous studies.

This is becoming a pattern. Every new study improves the measurements of the ice, and every new measurement increases the estimates of ice loss. The bottom line is that Greenland is melting really fast, pretty much everywhere. In a few decades, there will be no permanent ice on Greenland at all.

Wow. And, “glub”.


  1. Kathryn Hansen, Greenland’s largest ice stream is expected to contribute more to sea level rise than models previously indicated, in NASA Earth Observatory – Image of the Day, January 7, 2023. https://earthobservatory.nasa.gov/images/150801/thinning-of-the-northeast-greenland-ice-stream
  2. Shfaqat A. Khan, Youngmin Choi, Mathieu Morlighem, Eric Rignot, Veit Helm, Angelika Humbert, Jérémie Mouginot, Romain Millan, Kurt H. Kjær, and Anders A. Bjørk, Extensive inland thinning and speed-up of Northeast Greenland Ice Stream. Nature, 611 (7937):727-732, 2022/11/01 2022. https://doi.org/10.1038/s41586-022-05301-z

New Chart of the Antarctic Sea Floor

The ice is melting everywhere, including Antarctica.  So we’re science-ing the hell out of Antarctica, measuring the ice, the land, the air, everything.  And nothing is as important to grok what is happening to the icecap as the ocean.

In the case of Antarctica, it’s surrounded by the Southern Ocean, which features storms and currents which move warm water south towards the ice and north into the tropics.  These flows have a lot to do with how the ice behaves at the shores of Antarctica, as well as how the atmosphere behaves over the continent.

This ocean is huge, dangerous, and far away from were people live.  So we have relatively little detailed information about it, which limits the accuracy of climate models for the area.  We can’t predict the weather, ice, or anything very well without good data about the ocean.

One of the missing pieces has been a map of the ocean floor.  We know that sea ice and glaciers stick to the bottom if it is shallow enough, so the depth of water right off shore is a big influence on where the ice flows fast or slow into the sea. 

Undersea mountains and trenches have significant effects on currents at various depths.  These currents carry fresh water from precipitation and melting ice to mix into the saltier sea water, and also carry heat from warm water to cool water, and vice versa.  Exactly where these currents flow makes a huge difference to how fast the ice melts in a particular place.

In short, we want a good map of the ocean bottom.


This summer, version 2 of the International Bathymetric Chart of the Southern Ocean (IBCSO) has been released [2].  This dataset collects the best possible measurements of the sea bottom, and extends previous coverage from 60 degrees to 50 degrees south.  This is a very important increment, because the new coverage includes the Drake passage and critical regions of the Antarctic Circumpolar Current.

The dataset is aggregated from measurements by surface ships, aircraft, and satellites. Surface ships yield the most accurate and hi res data, but have limited coverage.  Lower quality air and space measurements are used to fill in as much of the area as possible.

Overall, on a grid of 500m squares, 23% of the cells have at least one depth measurement.  This is sparse, but it’s a lot better than version 1, which had only 17% coverage, all south of 60 degrees.  So, this is more area, and more data everywhere.

In addition to navigation and modelling, this undersea terrain records past behavior of the ice [1].  Studying these records will give us a better idea of where the ice was in past ages, which will improve models of how the climate has evolved over long periods.

From IBCSO

(Glancing at the map with a naked eye, I’m intrigued by the swirling pattern discernable in the sea bottom.  It looks like the elevation features reflect the continent rotating clockwise relative to the globe, or other processes pushing the seabed counter clockwise. Maybe it’s my imagination, but it’s interesting.)


  1. Jonathan Amos, Antarctica: Southern Ocean floor mapped in greatest ever detail, in BBC News – Science & Environment, June 8, 2022. https://www.bbc.com/news/science-environment-61723806
  2. Boris Dorschel, Laura Hehemann, Sacha Viquerat, Fynn Warnke, Simon Dreutter, Yvonne Schulze Tenberge, Daniela Accettella, Lu An, Felipe Barrios, Evgenia Bazhenova, Jenny Black, Fernando Bohoyo, Craig Davey, Laura De Santis, Carlota Escutia Dotti, Alice C. Fremand, Peter T. Fretwell, Jenny A. Gales, Jinyao Gao, Luca Gasperini, Jamin S. Greenbaum, Jennifer Henderson Jencks, Kelly Hogan, Jong Kuk Hong, Martin Jakobsson, Laura Jensen, Johnathan Kool, Sergei Larin, Robert D. Larter, German Leitchenkov, Benoît Loubrieu, Kevin Mackay, Larry Mayer, Romain Millan, Mathieu Morlighem, Francisco Navidad, Frank O. Nitsche, Yoshifumi Nogi, Cécile Pertuisot, Alexandra L. Post, Hamish D. Pritchard, Autun Purser, Michele Rebesco, Eric Rignot, Jason L. Roberts, Marzia Rovere, Ivan Ryzhov, Chiara Sauli, Thierry Schmitt, Alessandro Silvano, Jodie Smith, Helen Snaith, Alex J. Tate, Kirsty Tinto, Philippe Vandenbossche, Pauline Weatherall, Paul Wintersteller, Chunguo Yang, Tao Zhang, and Jan Erik Arndt, The International Bathymetric Chart of the Southern Ocean Version 2. Scientific Data, 9 (1):275, 2022/06/07 2022. https://doi.org/10.1038/s41597-022-01366-7

NASA Illustration of How Glaciers Melt

The ice is melting everywhere, but nowhere faster than Greenland.

One of the ways Greenland is melting is the retreat of glaciers, warmed by the air above and the sea below.

This month NASA reported on images of the Sverdrup glacier in western Greenland [1].   Not every glacier is changing in the same way, some are stable or even growing.

But Sverdrup is one of the ones that has dramatically retreated since 1998.  It has also thinned and started flowing faster to the sea.  Altogether, these changes have rapidly reduced the ice in the area.

The Oceans Melting Greenland project (with the aptly alarmist acronym, ‘OMG‘) reports that much of the melting is due to warm ocean water undercutting the glaciers [2].  <<link>>  The Atlantic Ocean water warmed over 1 degree in the period after 1998.

This ice loss is especially prominent where glaciers flow into deep fjords.  In fact, half the total loss of ice mass was from 74 of 226 glaciers surveyed which had deep fjords on the Atlantic.  NASA has a nice animation illustrating this process.


This finding is hardly unexpected.  It has long been assumed that warm sea water would undercut glaciers.  But this data provides solid evidence that this process not only happens but is extremely important in the loss of ice.  Changes in sea temperature are going to be reflected rapidly in Greenland and probably elsewhere.

The study indicates that models need to include the bathymetry of the sea floor where the glaciers meet the sea, and estimate the undercutting.  Without these factors, the ice loss will be vastly underestimated.


  1. Kathryn Hansen and Ian O’Neill, Warming seas are accelerating the retreat of Greenland’s coastal glaciers, in NASA Earth Observatory, January 26, 2021. https://earthobservatory.nasa.gov/images/147776/undercutting-sverdrup-glacier
  2. Michael Wood, Eric Rignot, Ian Fenty, Lu An, Anders Bjørk, Michiel van den Broeke, Cilan Cai, Emily Kane, Dimitris Menemenlis, Romain Millan, Mathieu Morlighem, Jeremie Mouginot, Brice Noël, Bernd Scheuchl, Isabella Velicogna, Josh K. Willis, and Hong Zhang, Ocean forcing drives glacier retreat in Greenland. Science Advances, 7 (1):eaba7282, 2021. http://advances.sciencemag.org/content/7/1/eaba7282.abstract

Ice Melt is Reaching a Tipping Point?

The oceans are heating faster than expected (slowing the changes in the atmosphere).

The southern Ice is melting in many places, possible everywhere.

And the northern Ice is rapidly disappearing altogether.  Up north, Greenland has been melting faster and faster.

The studies keep coming.

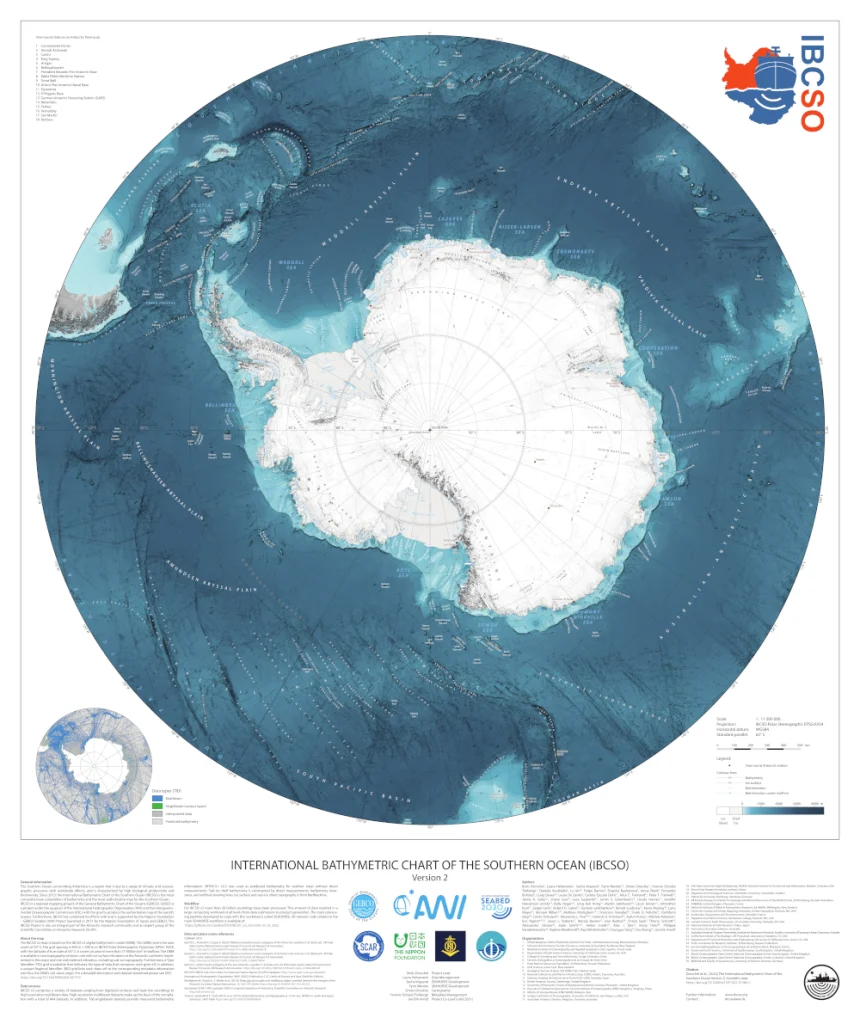
This month, an international team report a study of the “mass balance” for all the major “basins” of Antarctica [2].  Mass balance refers to the total loss due to melting and flow into the ocean balanced with the total gain of snowfall.

The picture is complicated, with Western Antarctica losing mass rapidly, generally attributed to warmer water undercutting glaciers at the coast.  Other areas have has less consistent changes, but overall most of Antarctica is losing mass (i.e. melting).

This is highly important, because the “lost” ice is melting into the ocean, raising sea levels.  If trends continue, this will raise mean sea level by several meters or more, producing major coastal flooding, at the very least.

And the news from the South is the good news.  Another team report a study of the correlation between the North Atlantic Oscillation (NAO) and the melting of the Greenland ice [1].  The NAO is a fluctuation cycle of air currents, i.e., the winds from the Western ocean onto Europe.  These winds bring more and less stormy and warm weather to Greenland as well as the continent.

“The negative phase of the NAO enhances summertime warming and insolation while reducing snowfall, especially in west Greenland, driving surface mass balance (SMB) more negative, “  ([1], p.1)

This study combines measurements of the mass of the ice inferred from the Gravity Recovery and Climate Experiment (GRACE) satellite and the Greenland GPS Network (GNET) surface measurements.  These data indicate the depth of the ice revealed in changes in gravity and the vertical movements of the rock underneath.

(When you think about it, this is really awesome science:  measuring the ongoing changes to the mass  and rise and fall of the crust.)

The results suggest that in recent decades the Greenland ice and snow has closely correlated with these winds, apparently more closely than in earlier times.  They interpret this to indicate that the mass balance in Greenland is much more responsive to the NAO cycles now, possibly indicating that the system has passed a “tipping point”.

“Greenland’s air-sea-ice system crossed one or more thresholds or tipping points, near the beginning of this millennium, triggering more rapid deglaciation” p.6

Specifically, the southwest coast of Greenland is receiving warmer winds, and melting rapidly. The patterns are not only related to the fluctuating winds, but also to the topography. Ocean terminating glaciers are melting very fast, and low lying ice is receiving less snow, leading to overall loss of mass.  Inland and high altitude ices is less affected by short term warming, and is changing relatively little.

“The decadal acceleration in mass loss in southwest Greenland arose due to the combination of sustained global warming and positive fluctuations in temperature and insolation driven by the NAO.”  (p. 6)

The “tipping point” argument is basically that the data show that “mass acceleration scales with the trend or rate of change of SMB and DMB”, i.e., the ice is responding rapidly to changes in  conditions, so all the continuing sources of warming are having immediate and larger effects every year.

As they say, “we infer that within two decades this part of the GrIS will become a major contributor to sea level rise.

Extreme sensitivity to environmental conditions means that, in principle, human actions to mitigate atmospheric and ocean warming will reverse the trends, and increase the ice mass.  However, it isn’t clear exactly how we might do that, and it is clear that it would take decades to make much difference.  By which time, the ocean will be over our heads.

So, get used to the idea that the ice will be gone, and the oceans will be higher.  Much higher.


  1. Michael Bevis, Christopher Harig, Shfaqat A. Khan, Abel Brown, Frederik J. Simons, Michael Willis, Xavier Fettweis, Michiel R. van den Broeke, Finn Bo Madsen, Eric Kendrick, Dana J. Caccamise, Tonie van Dam, Per Knudsen, and Thomas Nylen, Accelerating changes in ice mass within Greenland, and the ice sheet’s sensitivity to atmospheric forcing. Proceedings of the National Academy of Sciences:201806562, 2019. http://www.pnas.org/content/early/2019/01/14/1806562116.abstract
  2. Eric Rignot, Jérémie Mouginot, Bernd Scheuchl, Michiel van den Broeke, Melchior J. van Wessem, and Mathieu Morlighem, Four decades of Antarctic Ice Sheet mass balance from 1979–2017. Proceedings of the National Academy of Sciences, 116 (4):1095, 2019. http://www.pnas.org/content/116/4/1095.abstract